
Introducing LogMk, a straightforward alternative to complex logging tools like Grafana, tailored specifically for Kubernetes environments. Ideal for smaller setups or development scenarios, LogMk offers a lightweight, real-time log monitoring solution. This post will guide you through its setup, showcasing how it simplifies Kubernetes log management without the overhead typical of larger systems.
Source
If your want to check out the source and possible contribute to the project, check out the Github project here:
How LogMk Works
LogMk operates through a combination of components designed to efficiently monitor, store, and display Kubernetes pod logs in real-time. Here’s a breakdown of its operational architecture:
- Log Collection: The heart of LogMk lies in its .NET 8 worker agents, deployed as a DaemonSet across all Kubernetes nodes. These agents continuously monitor the log files from the pods, leveraging Kubernetes’ native logging architecture. Each node in the cluster runs an instance of the worker agent, ensuring comprehensive log coverage.
- Centralized Logging: As logs are collected, they are forwarded to a central MySQL database. This setup not only provides a unified view of all log data but also facilitates complex queries and long-term log storage, which is crucial for troubleshooting and historical analysis.
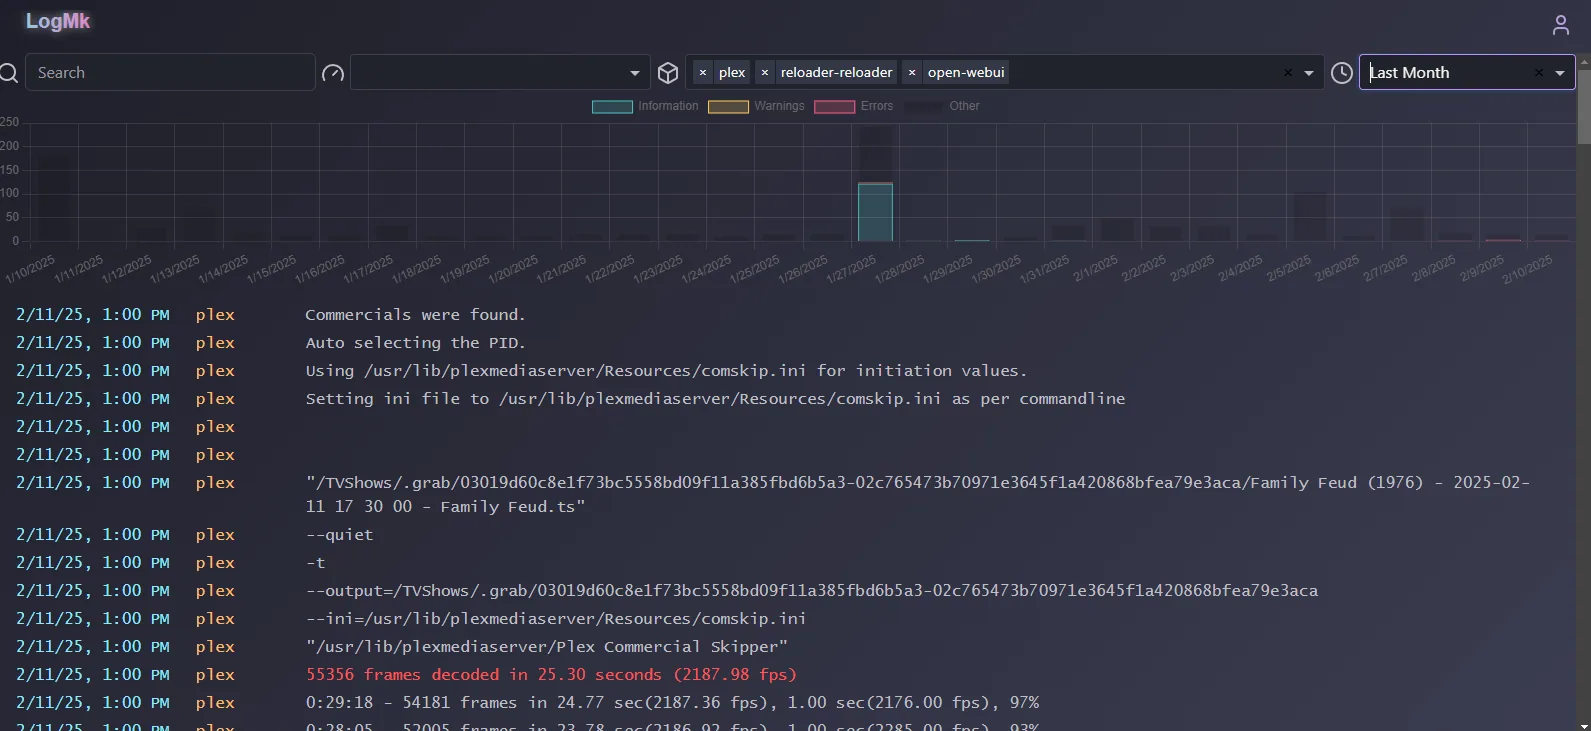
- Real-Time Viewing: The web portal serves as the user interface for LogMk, where logs can be viewed in real-time. Built with modern web technologies, the portal provides an interactive experience where users can filter, search, and drill down into specific log details without any perceptible delay.
- Configuration and Management: LogMk is configured via a ConfigMap, which contains settings for log levels, API endpoints, and other operational parameters. This allows users to customize the behavior of the logging system according to their specific needs.
- Security and Access Control: Integrated Kubernetes RBAC (Role-Based Access Control) ensures that only authorized users and processes can access log data. This is critical for maintaining the integrity and confidentiality of log information.
By combining these elements, LogMk simplifies the process of log management, making it accessible to developers and administrators without the need for extensive configuration or complex infrastructure adjustments typically associated with larger logging solutions like Grafana.
Features of LogMk
- Real-Time Log Monitoring: Keep an eye on your Kubernetes pod logs in real-time through an intuitive web portal.
- Centralized Storage: All logs are stored in a central MySQL database, making it easy to manage and retrieve log data.
- Filter and Search Functionality: Quickly find specific logs with robust filter and search capabilities.
- Simple Deployment: Setting up LogMk is straightforward. Deploy a .NET 8 worker agent across your Kubernetes nodes and begin monitoring logs instantly.
Prerequisites
Before you dive into setting up LogMk, ensure you have the following:
- A Kubernetes cluster
- A MySQL database to store the logs
- Metal-lb(optional) - how to install here
Setting Up LogMk
Below, we provide detailed steps and configurations to deploy LogMk within your Kubernetes environment.
For the Agent
Here’s how you can set up the LogMk agent using Kubernetes objects:
---
apiVersion: v1
kind: ConfigMap
metadata:
  name: logmk-agent-configmap
data:
  appsettings.json: |
    {
      "Logging": {
        "LogLevel": {
          "Default": "Debug",
          "Microsoft": "Warning",
          "Microsoft.Hosting.Lifetime": "Information",
          "System.Net.Http.HttpClient": "Warning"
        }
      },
      "LoggingApi": {
        "BaseUrl": "http://192.168.1.100"
      },
      "LogWatcherOptions": {
        "LogLevel": {
          "Default": "Any",
          "speaker": "Warning",
          "logmk-agent-container": "Warning"
        },
        "IgnorePods": ["dashboard-metrics-scraper"],
        "Paths": ["/var/log/pods"]
      }
    }
---
apiVersion: apps/v1
kind: DaemonSet
metadata:
  name: logmk-agent-daemonset
spec:
  revisionHistoryLimit: 0
  selector:
    matchLabels:
      name: logmk-agent
  template:
    metadata:
      labels:
        name: logmk-agent
    spec:
      nodeSelector:
        kubernetes.io/arch: amd64
      serviceAccount: logmk-agent-serviceaccount
      securityContext:
        fsGroup: 1000
      containers:
        - name: logmk-agent-container
          image: timdoddcool/logmk-agent:latest
          volumeMounts:
            - name: logs
              mountPath: /var/log
              readOnly: true
            - name: appsettings-volume
              mountPath: /app/appsettings.json
              subPath: appsettings.json
          securityContext:
            runAsUser: 1000
      volumes:
        - name: logs
          hostPath:
            path: /var/log
        - name: appsettings-volume
          configMap:
            name: logmk-agent-configmap
For the API
Deploy the LogMk API to handle requests and serve data to the web portal:
apiVersion: apps/v1
kind: Deployment
metadata:
  name: logmk-api
  labels:
    app: logmk-api
spec:
  revisionHistoryLimit: 0
  replicas: 1
  selector:
    matchLabels:
      app: logmk-api
  template:
    metadata:
      labels:
        app: logmk-api
    spec:
      containers:
        - name: logmk-api
          image: timdoddcool/logmk-api:latest
          imagePullPolicy: IfNotPresent
          env:
            - name: ConnectionStrings__DefaultConnection
              valueFrom:
                secretKeyRef:
                  name: mail-void
                  key: connection
            - name: JwtSettings__Secret
              valueFrom:
                secretKeyRef:
                  name: logmk-jwt
                  key: password
            - name: JwtSettings__ExpiryMinutes
              value: "43200"
      nodeSelector:
        kubernetes.io/arch: amd64
---
apiVersion: v1
kind: Service
metadata:
  name: logmk-api-lb
spec:
  selector:
    app: logmk-api
  ports:
    - port: 80
      targetPort: 8080
      name: http
  type: LoadBalancer
  loadBalancerIP: 192.168.1.100
For the Web Portal
Finally, set up the web portal which will communicate with the API to display logs:
apiVersion: apps/v1
kind: Deployment
metadata:
  name: logmk-web
  labels:
    app: logmk-web
spec:
  revisionHistoryLimit: 0
  replicas: 1
  selector:
    matchLabels:
      app: logmk-web
  template:
    metadata:
      labels:
        app: logmk-web
    spec:
      containers:
        - name: logmk-web
          image: timdoddcool/logmk-web:latest
          imagePullPolicy: IfNotPresent
          env:
            - name: API_URL
              value: "http://192.168.1.100"
      nodeSelector:
        kubernetes.io/arch: amd64
---
apiVersion: v1
kind: Service
metadata:
  name: logmk-web-lb
spec:
  selector:
    app: logmk-web
  ports:
    - port: 80
      targetPort: 80
      name: http
  type: LoadBalancer
  loadBalancerIP: 192.168.1.101
Once deployed you can access the portal by going to http://192.168.1.101, the default user and password is admin.
Conclusion
LogMk provides a straightforward, efficient way to monitor logs in Kubernetes environments. Its lightweight nature makes it ideal for smaller operations and development setups. Visit the LogMk GitHub repository for more details and to download the source code.
Feel free to adjust this draft to better fit your voice or add additional sections as needed for clarity and engagement!