
Almost two years ago I wrote about LogMk, my lightweight alternative to a full Grafana stack for watching Kubernetes pod logs. The pitch was simple: a .NET agent runs as a DaemonSet on every node, tails /var/log/pods, batches the lines over HTTP to a central API, stores everything in MySQL, and streams it to an Angular UI over SignalR.
And it worked. It still works. But somewhere along the way I noticed that almost none of my time on LogMk was going into the part I actually cared about — looking at logs. It was going into the database underneath them.
The problem with storing everything
LogMk’s design commits you to ingesting every log line your cluster produces, forever arriving, into one big MySQL table. At homelab scale that sounds harmless. In practice, my LogMk todo list slowly turned into a catalog of database chores:
- Fingerprint columns and batch IDs for deduplication, so agent retries don’t double-insert.
- Hourly and daily rollup tables, because charting against the raw table got slow.
- A nightly retention purge, and then an async work queue behind it, because bulk-deleting millions of rows locks the table.
- Eight composite indexes, keyset pagination to replace offset pagination, bounded queues and circuit breakers in the agent so an API outage doesn’t OOM a node.
Every one of those was a real fix for a real problem. But step back and the shape of the thing is absurd for a homelab: the kubelet already writes every log line to disk on the node. LogMk tailed that file, shipped it across the network, and wrote it to disk again — so I could look at it in a browser. I was maintaining a small log-ingestion database product, and all I ever did with it was glance at the last hour of logs.
Meanwhile the Kubernetes API already does everything I actually used LogMk for. It serves live resource metrics through metrics.k8s.io. It has watch streams for pods, nodes, and events. And it will happily stream any pod’s logs to you with follow=true — the same thing kubectl logs -f uses.
So I stopped shipping logs and built Portside instead.
What is Portside?
Portside is a lightweight, self-hosted Kubernetes dashboard — ASP.NET Core 10 on the back, Angular 21 on the front, SignalR in between for live updates. It gives you:
- A cluster overview: aggregate CPU/memory plus per-node cards.
- A pod table with search, namespace and status filters, 24-hour error/warning counts, and a CPU sparkline per pod.
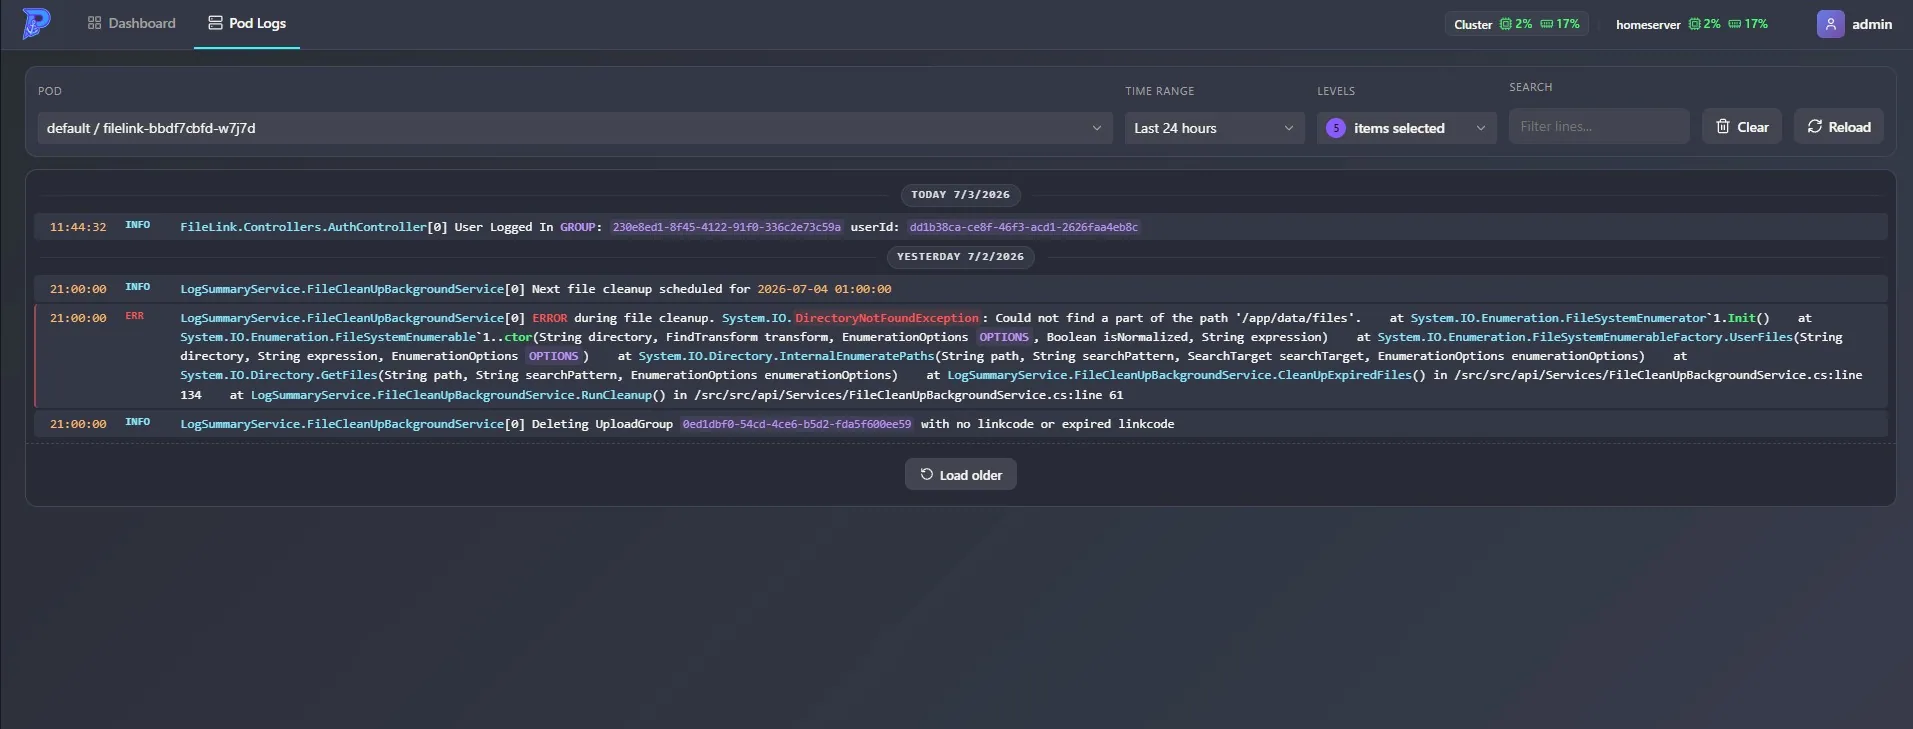
- A live pod log viewer with multi-level and time-range filtering, search highlighting, and day dividers — streamed straight from the Kubernetes API.
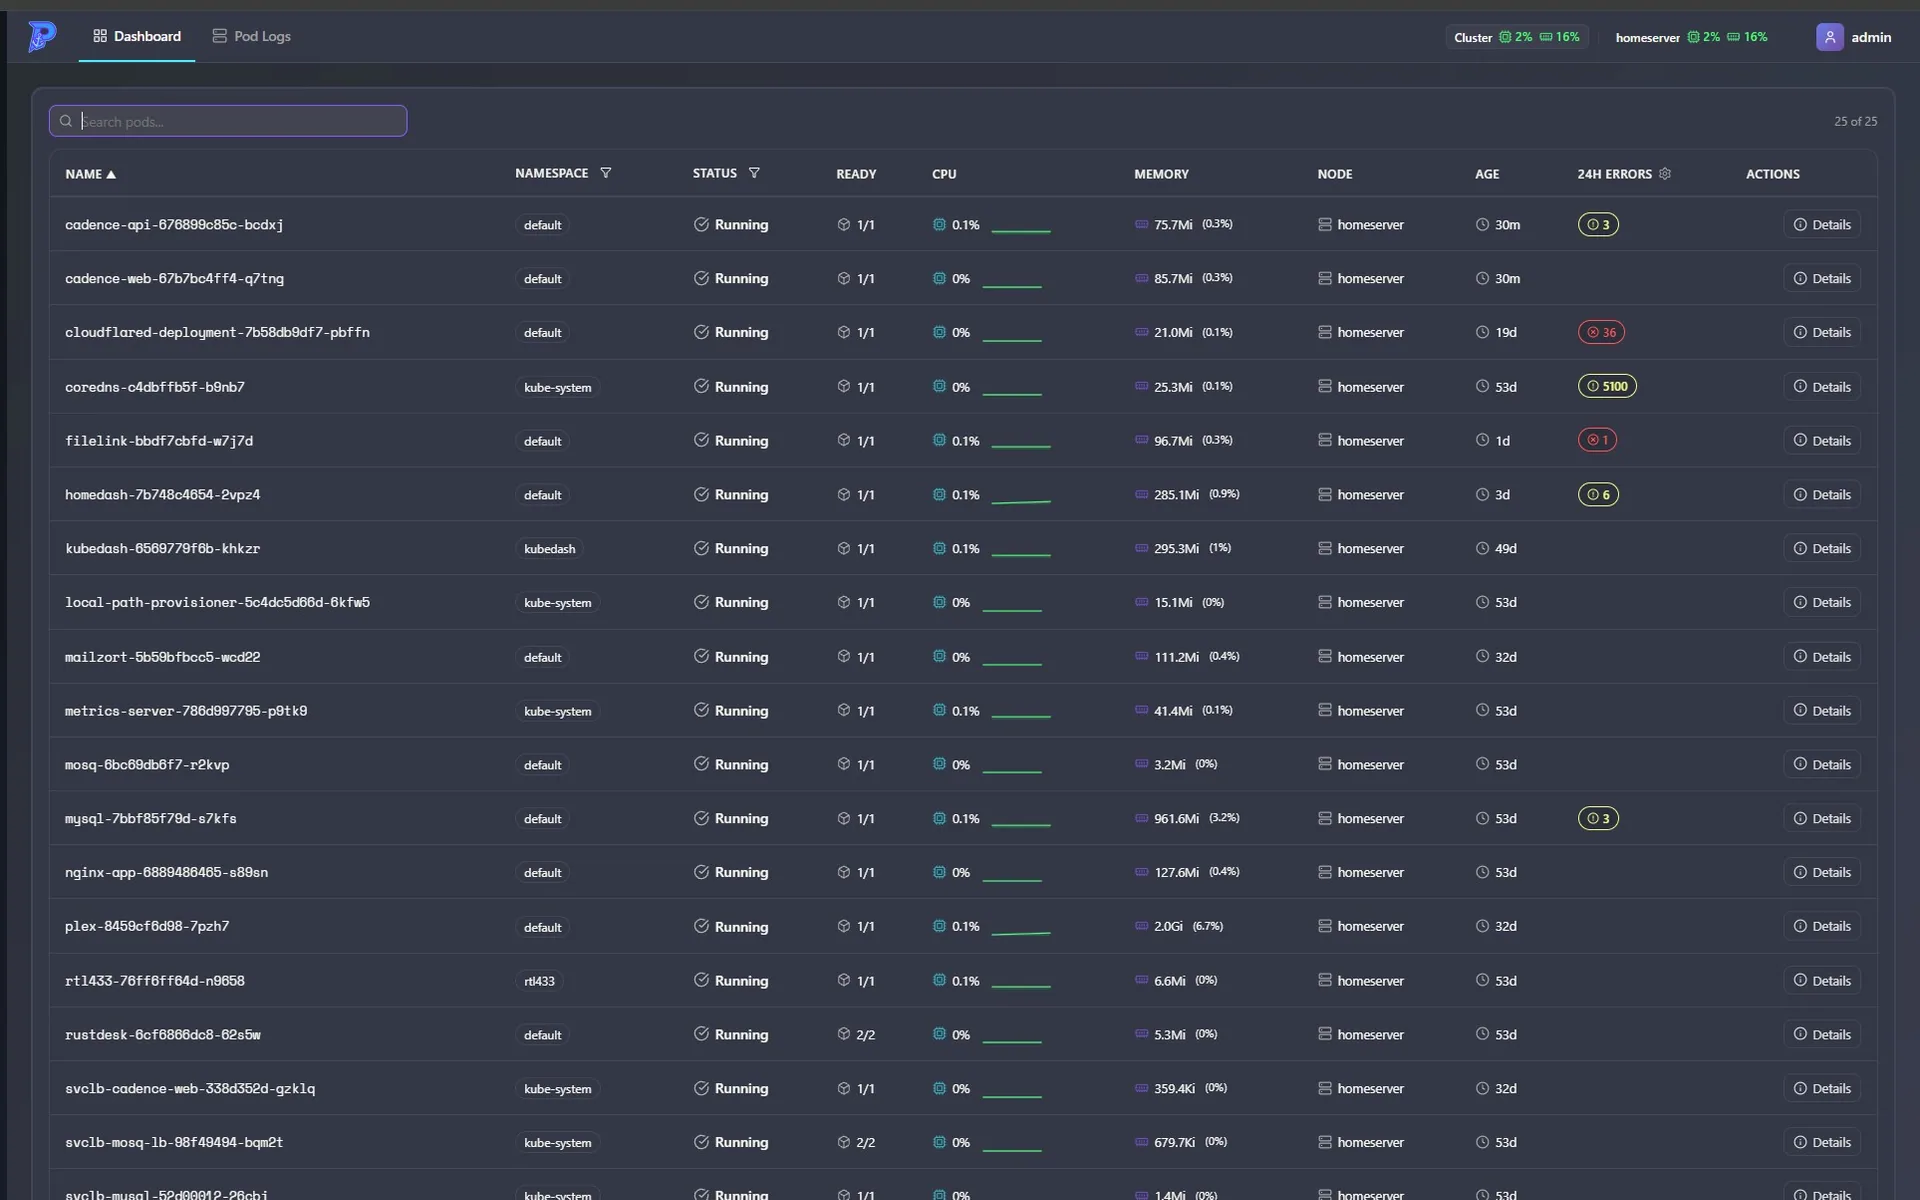
The word doing all the work in that description is agentless. There is no DaemonSet, no log database, no ingestion pipeline. You deploy one container, grant it a read-only role, and it asks the cluster for what it needs while you’re looking at it.
Browser
  → Portside (ASP.NET Core + SignalR)
    → Kubernetes API (watches, metrics.k8s.io, pod log streams)
One read-only role, nothing else in the cluster
Everything Portside shows comes through the Kubernetes API under a single read-only ClusterRole. The trimmed version:
apiVersion: rbac.authorization.k8s.io/v1
kind: ClusterRole
metadata:
  name: portside-reader
rules:
  - apiGroups: [""]
    resources: [nodes, namespaces, pods, pods/log, services, events]
    verbs: ["get", "list", "watch"]
  - apiGroups: ["apps"]
    resources: [deployments, replicasets, statefulsets, daemonsets]
    verbs: ["get", "list", "watch"]
  - apiGroups: ["metrics.k8s.io"]
    resources: [pods, nodes]
    verbs: ["get", "list"]
The only state Portside keeps for itself is a small SQLite file: users, refresh tokens, UI preferences. Cluster data is never persisted — what you see is what the cluster says right now.
Live logs without an agent
The log viewer is the piece that directly replaces LogMk, so it got the most attention.
When you open a pod’s logs, Portside opens a follow stream against the Kubernetes API and relays lines to your browser over a SignalR hub. The streams are reference-counted and multiplexed: if three browser tabs are watching the same pod, there’s still exactly one upstream stream to the API, and it’s torn down the moment the last subscriber leaves. Pods with multiple containers get all their containers streamed concurrently into one merged view.
Raw container logs are ugly, so each line runs through a cleaner built on .NET source-generated regexes. It strips ANSI color codes and the redundant prefixes apps love to emit — 13:24:54 info:, [INFO], WARN:, syslog <6> priorities — because the viewer already renders timestamp and level as their own columns. Log level is inferred from the line content, which powers the level filters and the error/warning counts.
On top of that stream the UI layers the conveniences I kept reaching for in LogMk: time-range presets from five minutes to 24 hours, a “load older” that pages back through historical lines, live search with highlighting, day dividers, and a pause button that queues incoming lines instead of dropping them while you’re reading.
Only working when someone’s watching
My favorite design decision in Portside is the one that makes it the opposite of an agent: it does nothing when nobody’s looking.
The Kubernetes watch streams (pods, nodes, events) and the metrics poller are reference-counted against SignalR connections. The first dashboard client to connect starts them; when the last client disconnects, they stop. Idle, Portside consumes zero cluster API quota — compare that to a DaemonSet agent tailing files and POSTing batches on every node, 24/7, whether or not anyone will ever read those rows.
Transient metrics-server hiccups get exponential backoff (30 seconds, capped at 5 minutes) with throttled logging, so a flaky metrics API doesn’t fill Portside’s own logs with noise.
The overnight question
The one thing a pure “live view” can’t answer is the question I asked LogMk most often: did anything blow up overnight?
Portside covers this with an in-memory rolling window instead of a database. While monitoring is active, a background service samples every pod’s CPU and memory and counts error/warning log lines, keeping 24 hours of history. That history feeds the pod table: each pod gets a 24-hour error/warning count and a CPU sparkline, downsampled into evenly spaced buckets, with gaps carried forward so a pod that was quiet for an hour doesn’t render as a dip to zero.
It’s not a log archive. It’s exactly enough signal to tell you which pod had a bad night, and then you’re one click from its logs.
The honest trade-off
Portside shows you what the cluster still has. The kubelet rotates container logs, and when a pod is deleted, its logs go with it. LogMk’s MySQL gave me 30 days of searchable history; Portside deliberately gives me none.
For my homelab, that trade turned out to be free — in two years I never once needed the archive, only the live view and the morning-after check. But if you genuinely need retention (compliance, postmortems across pod restarts, long-tail debugging), pair a dashboard like this with a real aggregation stack — I’ve written up a Loki + Promtail + Grafana setup on k3s that fills that role — or keep something like LogMk around for the storage half.
Stack notes
A few things under the hood, for the curious:
- .NET 10 + the official
KubernetesClient. In-cluster it uses the mounted ServiceAccount; running locally it picks up your~/.kube/configautomatically, sodotnet runagainst a real cluster just works. - Angular 21, zoneless, signal-based standalone components, with Chart.js for the resource charts.
- Dogfooding: auth and preferences persist through RoboDodd.OrmLite, my ServiceStack-OrmLite-compatible ORM built on Dapper, and the UI shares components with my other projects via an
rd-uilibrary. Both come in as git submodules — clone with--recurse-submodulesor the build will let you know. - JWT auth with refresh-token rotation, rate-limited login, and a seeded
admin/adminuser you’re prompted to change.
Running it
The image is published to Docker Hub as timdoddcool/portside. To try it against whatever cluster your kubeconfig points at:
docker run -p 8080:8080 \
  -v $HOME/.kube:/home/app/.kube:ro \
  -v portside-data:/app/data \
  timdoddcool/portside:latest
For a permanent home on k3s, the repo ships a complete manifest under deploy/k3s/ — namespace, ServiceAccount, the read-only ClusterRole, a Secret for the JWT signing key, a 1Gi PVC for the SQLite store, liveness/readiness probes wired to /api/health/live and /api/health/ready, and a Traefik ingress. It runs a single replica with strategy: Recreate (SQLite is a single-writer affair) and asks for a modest 100m CPU / 256Mi.
# Generate a real JWT secret and paste it into the manifest first.
openssl rand -base64 48

kubectl apply -f deploy/k3s/portside.yaml
Log in as admin / admin, change the password from the user menu, and you’re done — there is no step two, because there’s no agent to roll out.
Get Portside
Portside is open source under MIT:
- Source: github.com/timothydodd/portside
- Container:
timdoddcool/portside:latest
LogMk isn’t going anywhere — the repo and the original post still stand, and if you want stored, searchable log history in MySQL it still does that job. But if what you actually do is watch logs, not warehouse them, skip the pipeline. The cluster already has your logs — Portside just shows them to you.